How I met xaringan 
An R user who would like to share awesome things in R
How I met xaringan
An R user who would like to share awesome things in R
by showing a bunch of R code snippets without losing taste.

How I met xaringan
An R user who would like to share awesome things in R
by showing a bunch of R code snippets without losing taste.
given no time nor money on formatting codes and adjusting layouts.
Meet xaringan
Beautiful and concise layout

Meet xaringan
Code highlighting and live demos
Meet xaringan
Version control and easy distribution


Meet xaringan
It animates

Infinite moon reader 👩🚀
Do you use ctrl + K to render your slides?
- So, Are you tired from scrolling down to the page you were working on?

Infinite moon reader 👩🚀
Do you use ctrl + K to render your slides?
- So, Are you tired from scrolling down to the page you were working on?
Turn on the Moon Reader from either the pacakge or the addins
From now on, the slides will auto-reload every time you save it
Infinite moon reader 👩🚀


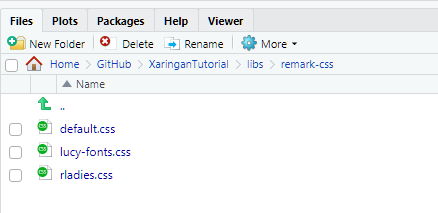
Where to find the themes files?
You can find CSS files here. However, don't save your own CSS file here.
Where to find the themes files?
You can find CSS files here. However, don't save your own CSS file here.
- start with an existing theme
- try change something and see what happens
Meet slidex
It converts PowerPoint slides to xaringan slides

Two-columns
.left-column[```{r evel = FALSE}Your R code```].right-column[```{r evel = FALSE, echo = FALSE}Your R code```].left-column and .right-column provide 20% and 75% width

head(gss_cat)Two-columns
.left-column[```{r evel = FALSE}Your R code```].right-column[```{r evel = FALSE, echo = FALSE}Your R code```].left-column and .right-column provide 20% and 75% width
head(gss_cat)## # A tibble: 6 x 9## year marital age race rincome partyid relig denom tvhours## <int> <fct> <int> <fct> <fct> <fct> <fct> <fct> <int>## 1 2000 Never ma~ 26 White $8000 to~ Ind,near ~ Protest~ Southe~ 12## 2 2000 Divorced 48 White $8000 to~ Not str r~ Protest~ Baptis~ NA## 3 2000 Widowed 67 White Not appl~ Independe~ Protest~ No den~ 2## 4 2000 Never ma~ 39 White Not appl~ Ind,near ~ Orthodo~ Not ap~ 4## 5 2000 Divorced 25 White Not appl~ Not str d~ None Not ap~ 1## 6 2000 Married 25 White $20000 -~ Strong de~ Protest~ Southe~ NAAdd a plot
par(mar = c(4, 4, 1, 0.1))plot(cars, pch = 19, col = "darkgray", las = 1)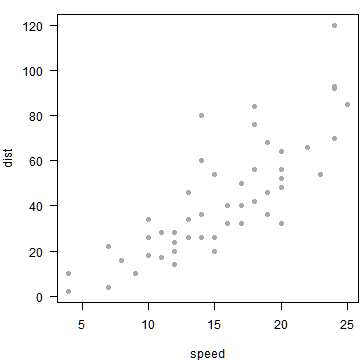
use fig.height and fig.width to control the size
Add an image
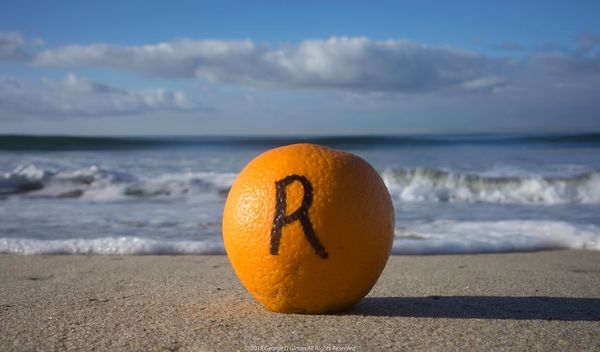
Resize it
Should it be something like {width=10px} ? 😢
Option 1:
<img src="imgs/ocrug.jpeg" width="20%" />
Resize it
Should it be something like {width=10px} ? 😢
Option 1:
<img src="imgs/ocrug.jpeg" width="20%" />
Option 2:
```{r out.width = "20%", eval=TRUE}knitr::include_graphics("imgs/ocrug.jpeg")```
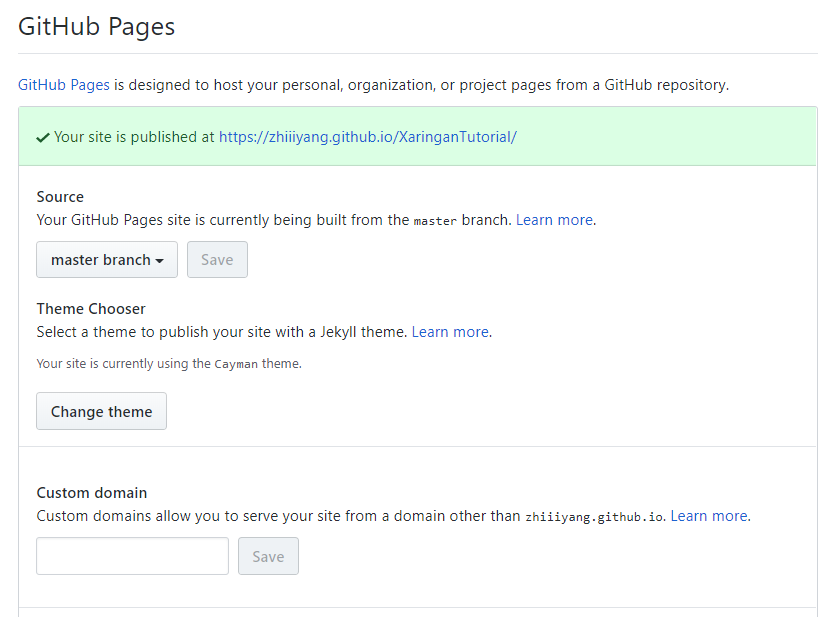
Hosting slides
Netlify 💻
Step 1: go to netlify.com
Step 2: connect with your Github account
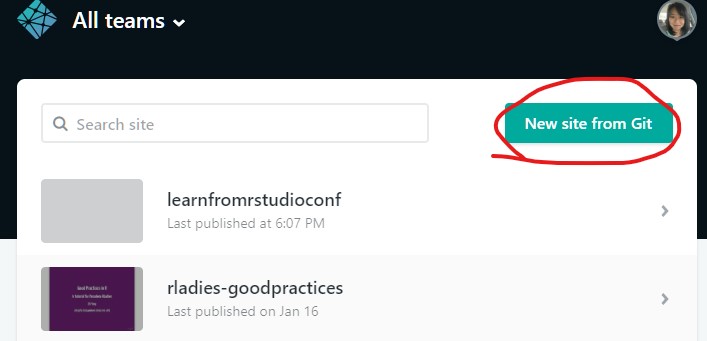
Netlify 💻
Step 3: select a repo
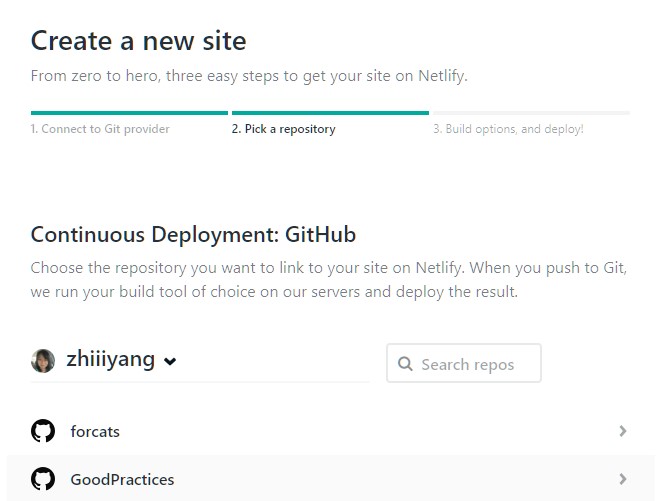
Netlify 💻
Step 3: select a repo
Step 4: select a branch
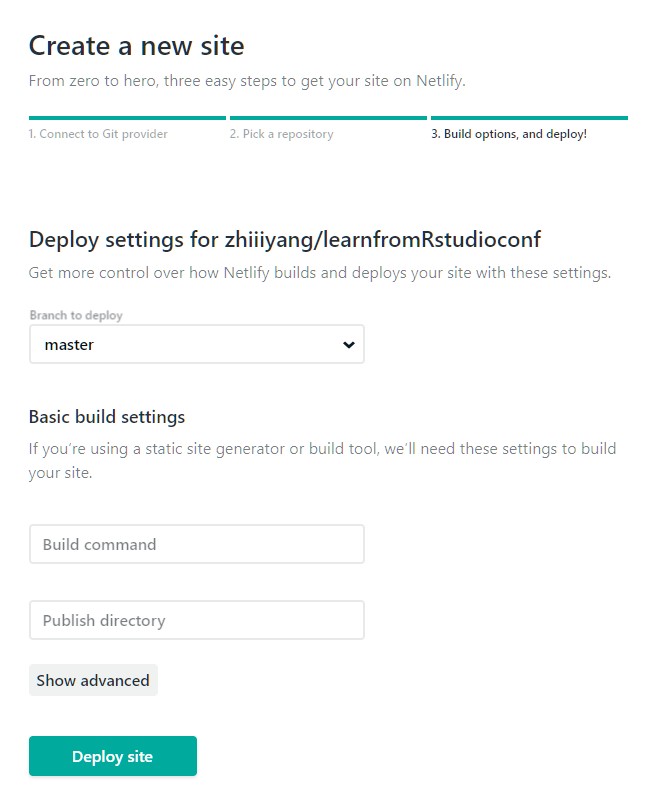
Netlify 💻
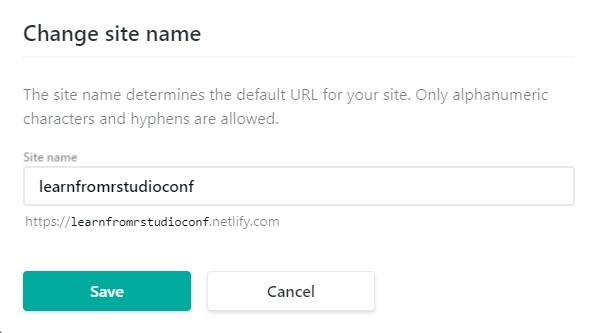
Step 5: deploy a site
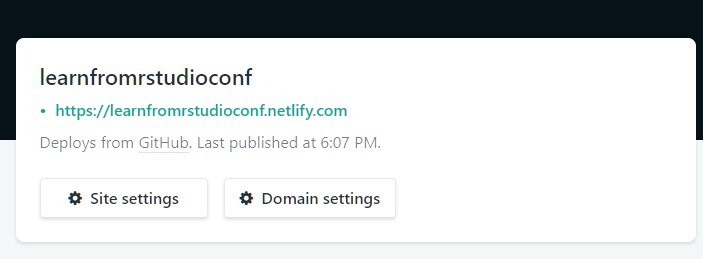
Step 6: change site name
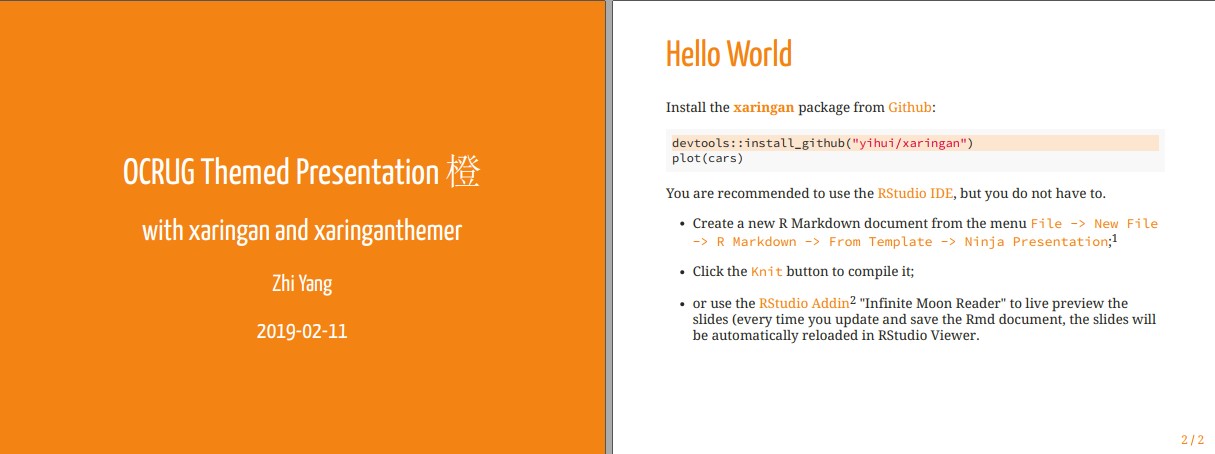
More info...